This project is to choose a man-made object/process or discovery and break it down into its component parts, functions, flows. We had to choose a process/evolution that can be pulled apart and shown within a context in a visually dynamic way.
Brainstorming Process
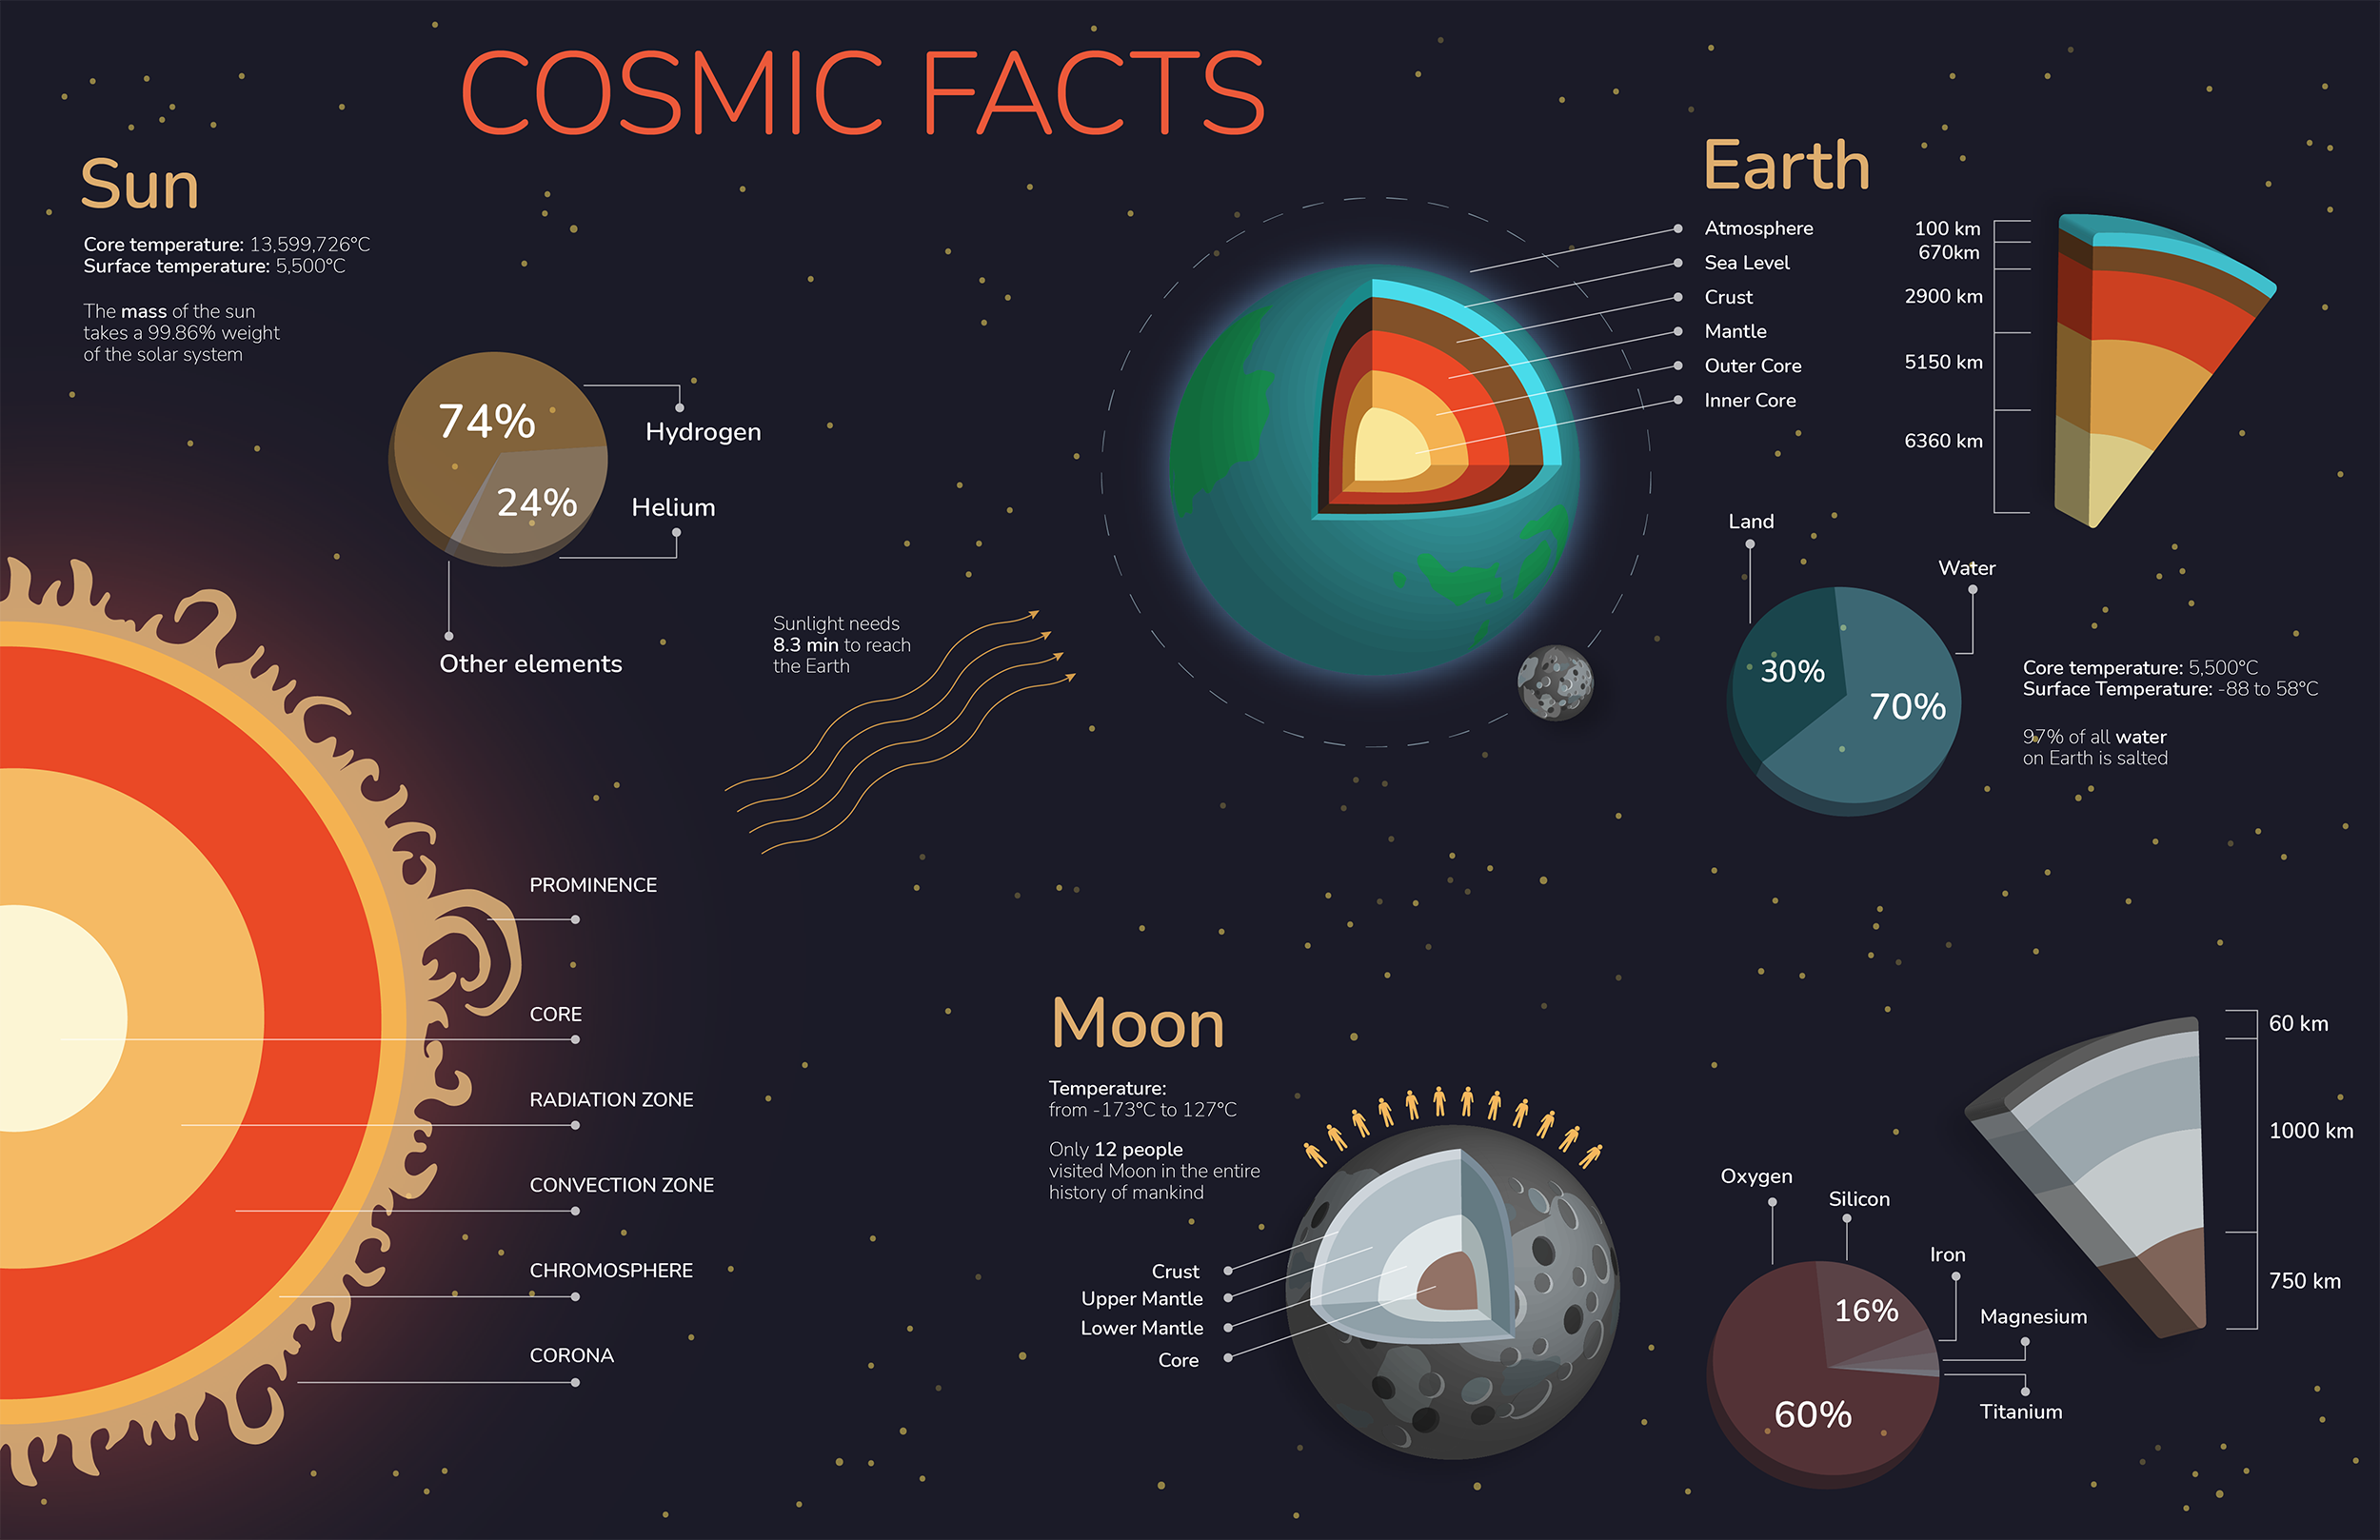
To start with the assignment, I needed to decide on the subject for the poster. We were advised to use informationisbeautiful.net for inspiration. One of my favourite subjects is anything related to space/planets/rockets, so I chose a solar system as my subject. I gathered some examples of similar infographic posters for inspiration and comparison purposes.
Drawing Process
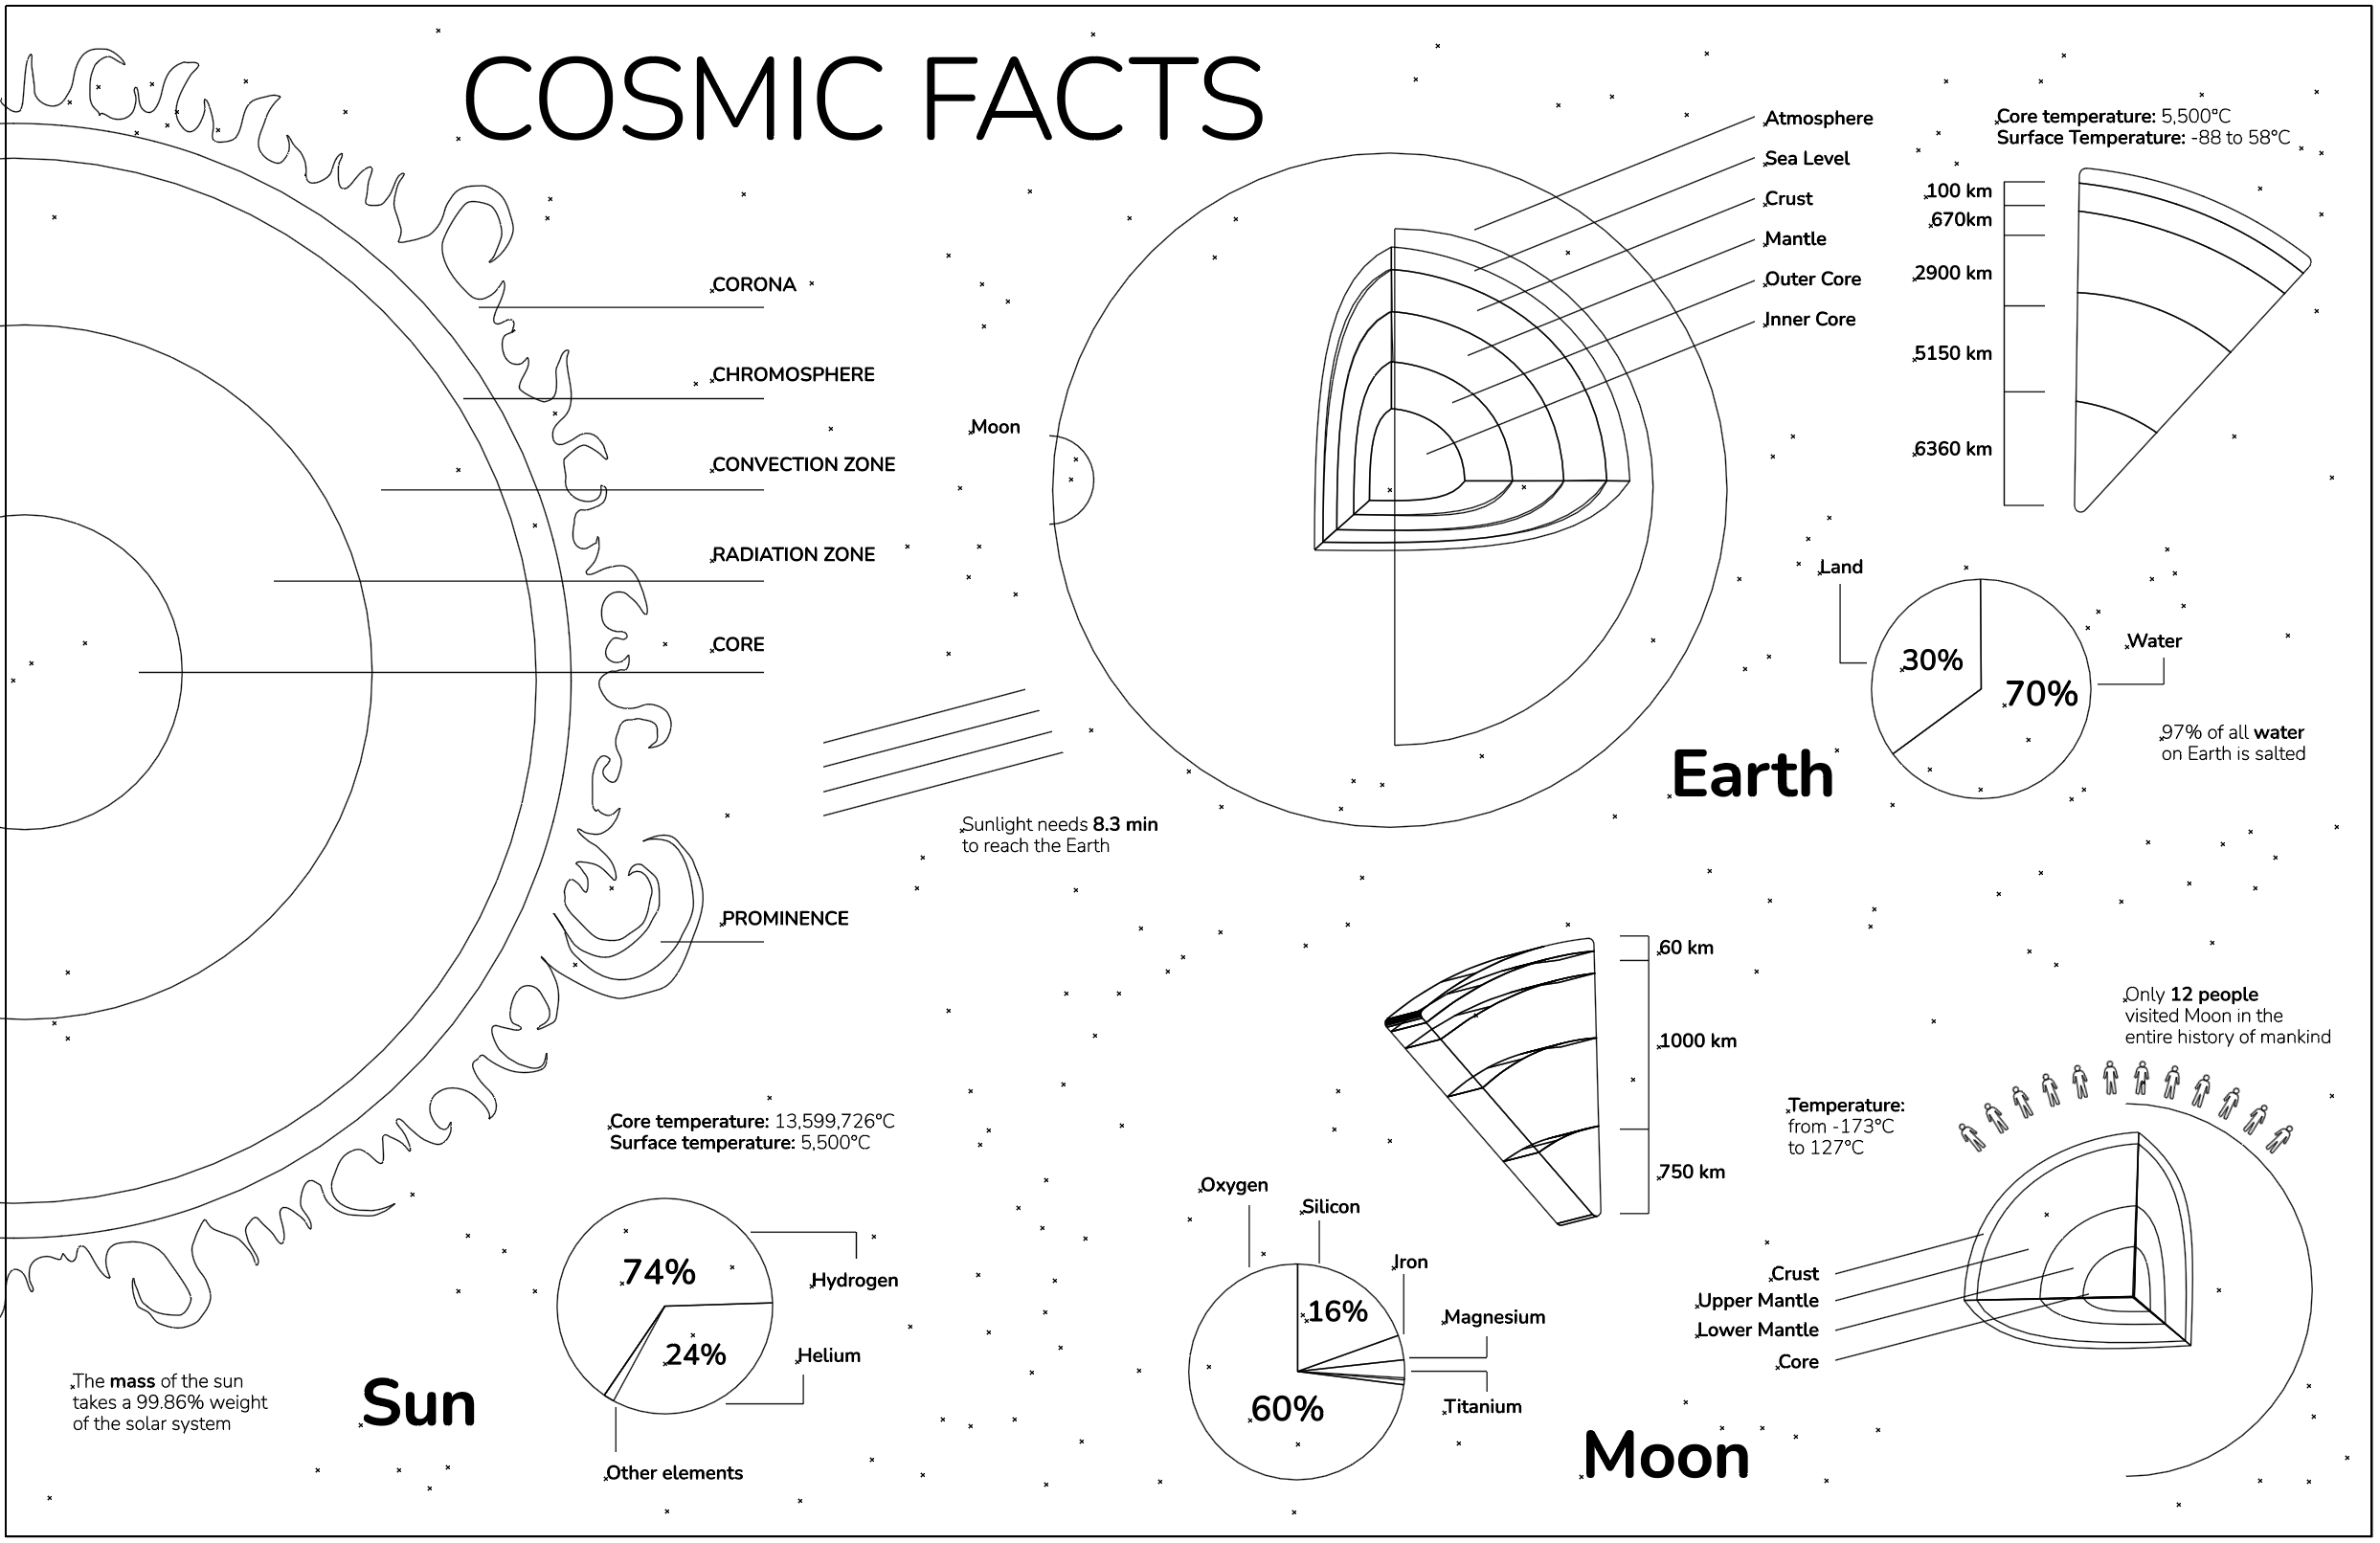
I did research on the topic and gathered some info for the project. After the initial layout was finished, I began drawing the shapes with Adobe Illustrator. After the basic design with shapes and colours was finished, I began rearranging elements and choosing effective font combinations.
Edits to Drawing
After submitting my completed drawing I had to do minor changes to the project. I rearranged the groups of elements in a more effective way, changed typography so the hierarchy on the page was more clear, and changed some colours to achieve a more consistent look.
Source of the references:
https://www.jpl.nasa.gov/infographics
https://earthhow.com/category/outer-space/